My application for RD might be a bit different to most, I’m using it for home automation and energy monitoring and I’m slowly building more and more into it.
I use an STM32 to interface with my solar inverters and grid meter, and this connects to an old phone via RS232 (RealDashCAN) with RD running and then multicast to my phone.
So my phone is where I want to view everything and show the running history for the day, but RD is only ever turned on briefly. A Graph Gauge is great for the time RD is running, showing the most recent history, but it obviously stops when the app is closed.
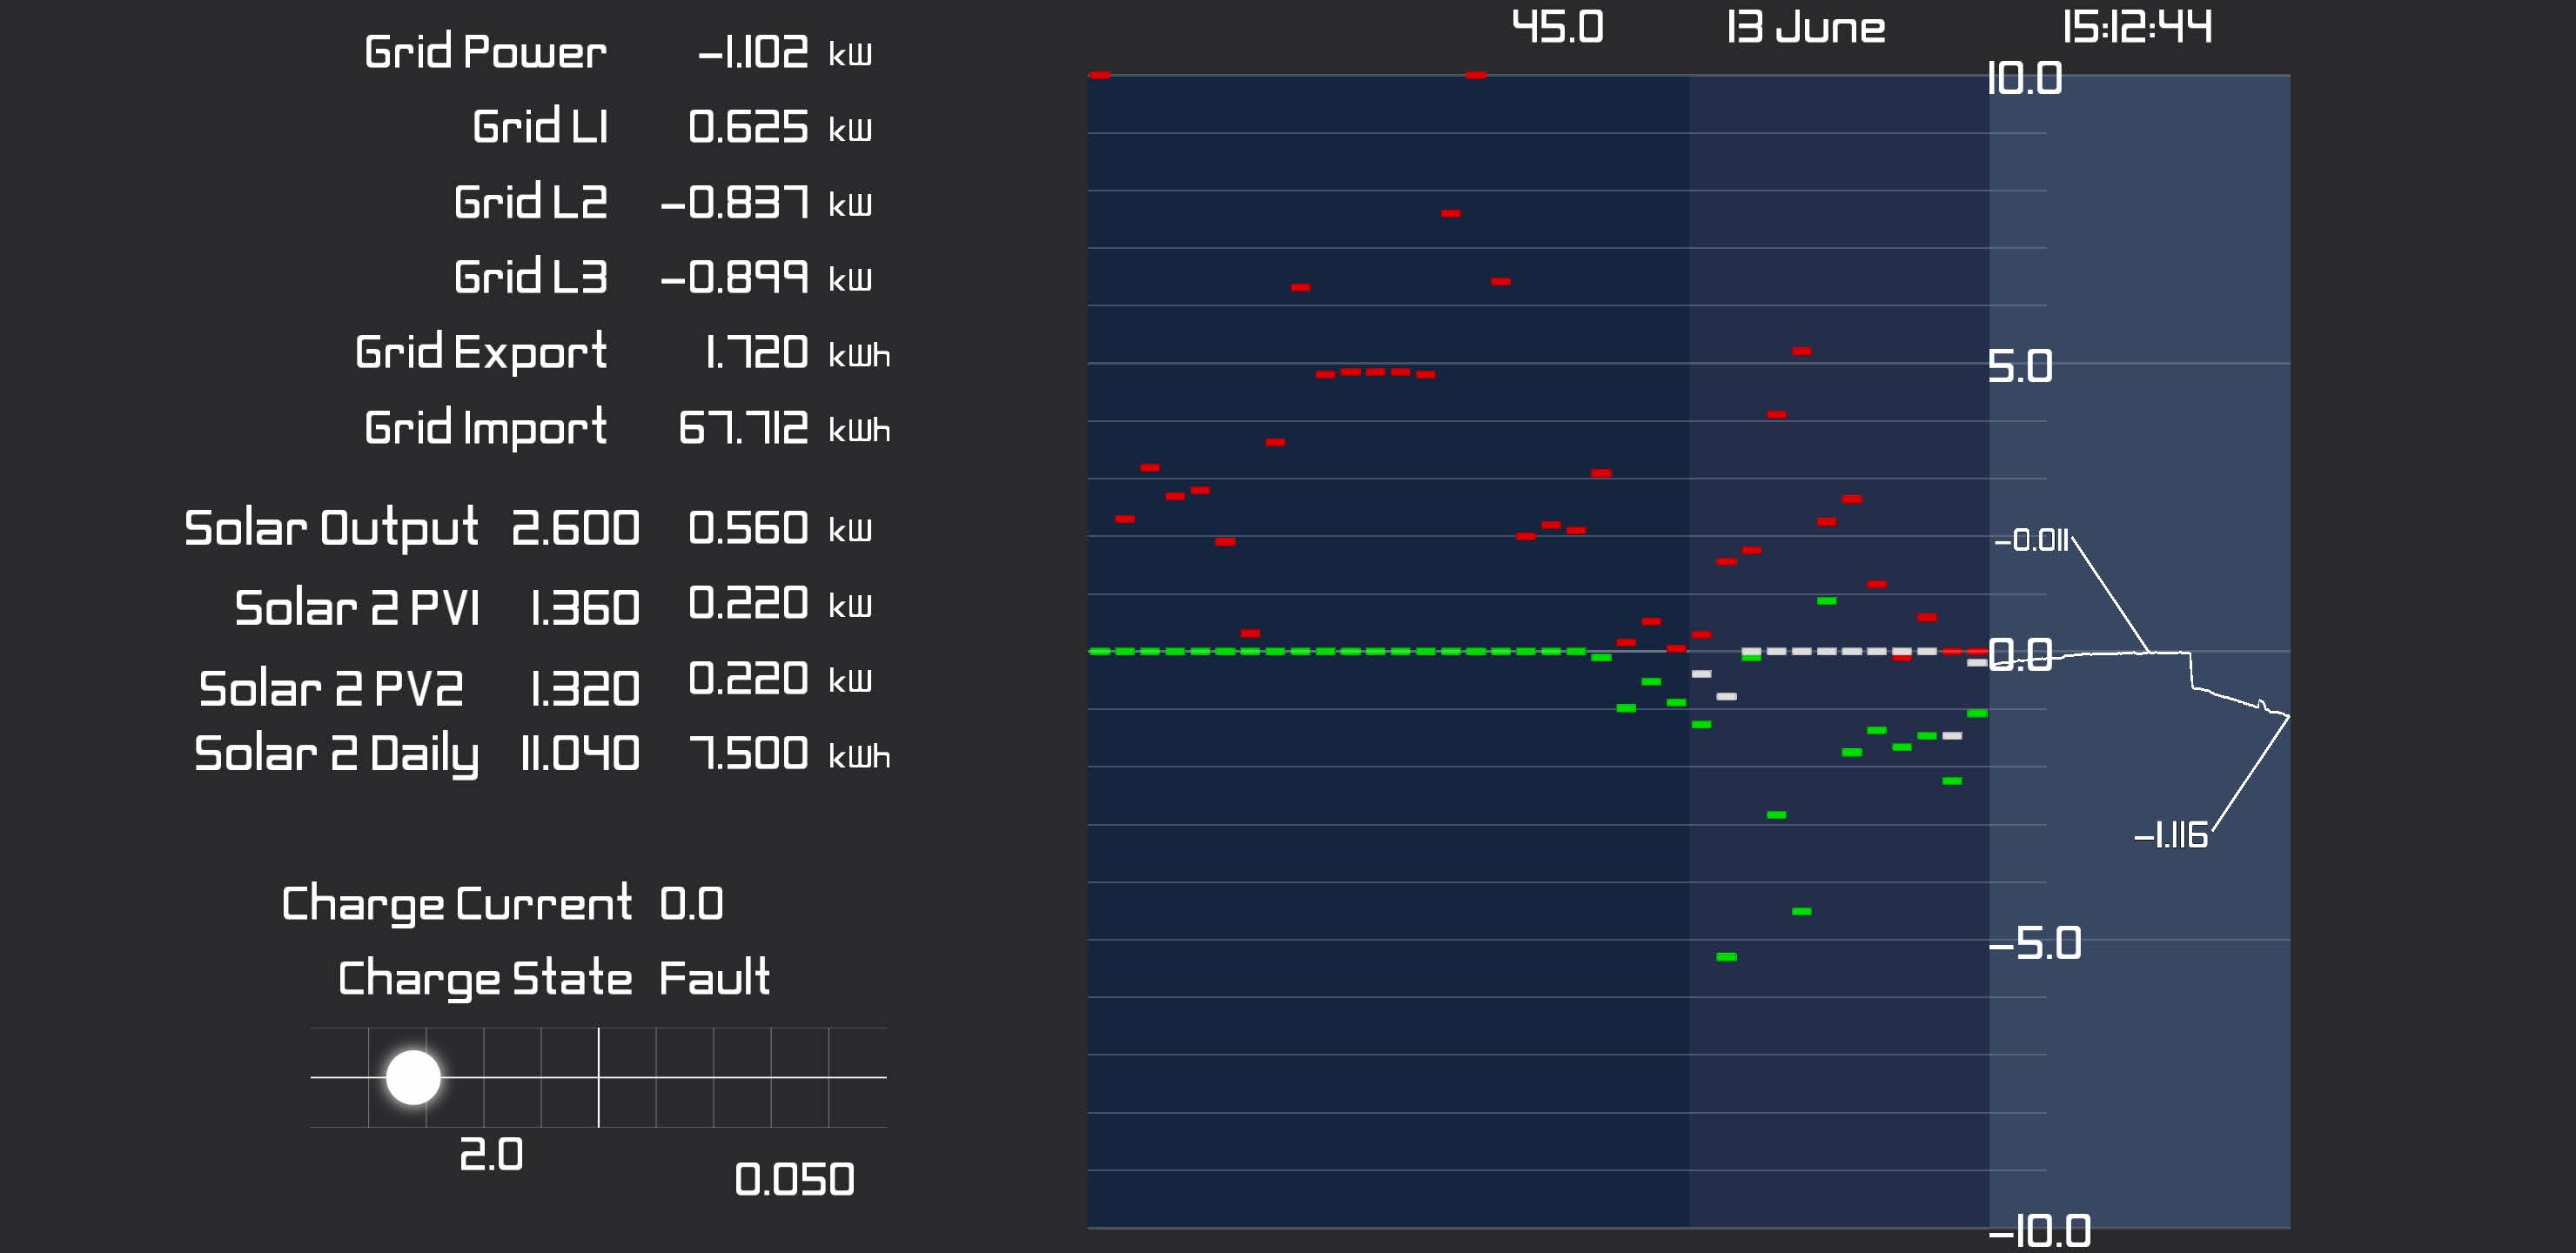
I stuck a bunch of narrow Indicator Bars together which gives me energy used each hour for the last 24hrs, but it looks pretty terrible -
I have my phone sending App Uptime back to the STM32 so I can see when it’s connected, so what I’d like to be able to do is draw the graphs when RD connects since the STM32 logs the data 24/7.
Without asking for a whole new component, I though the Axis Gauge could do the job with a tweak. If the functionality of the History Tail could be extended a bit so that we could specify the number of samples of the tail, and each point was connected by a line then I could draw my graphs by sending the XY of each point, say a few hundred points should give a pretty good graph and only take a few seconds to draw. Or you could just have permanent tail but a method to clear it, say via an action?
If there’s another way I could display this type of data, let me know.