Does anyone know how to make this bar go up and down, like fuel and temperature, or how to configure it so that it works with temperature and fuel?
Use two layers:
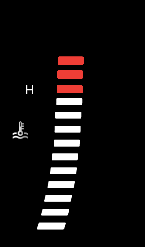
- Image gauge with full red bars
- Bar Gauge with white bars set as background image.
- Link your bar gauge to coolant temperature and set the range in ‘Units & Values’.
- White bar will now build on top of the red one as coolant temperature rises.
Thank you, but could you specify better how to do this? I’m new to RealDash and its features. The effect would be like the one below in the video.

If you are serious about making dashboards with RealDash, I’d recommend that you use day or two just experimenting with different gauges. You will get a hang of it pretty quickly.
The bar appearing can be done with single Bar Gauge, alas it will not show the bar ‘notch-by-notch’. If that is important to you, you may want to experiment with Indicator Cluster gauge type with single ‘bar’ as indicator image.