I am trying to display the temperature distribution of a single tire.
I want to gradually change the color of the Image gauge like wheel temp on the Racing Simulator dashboard.
When I set it, the color suddenly changes at the warning threshold.
How should I set it?
This template changes colors gradually, but if I create a new image gauge, I can’t do the same thing. . . .
Thanks! cool!
I tried the Graph Gauge Flatline and it works great.
by the way
What should I do if I only want to display the current temperature?
Simplest way is to just add a text gauge for it.
I have been using FLATLINE for a while.
It really works great.
FLATLINE can also view past data, but I would like to have only a color display of the current temperature.
How can I do this?
The minimum time axis of FLASTLINE is 1sec, but I would like to make this as close to 0sec as possible!
For immediate display, I would use Image Gauge (without an image) and adjust its background color with ‘Use Dynamic Color Range’ option to make smooth color changes.
Thank you!
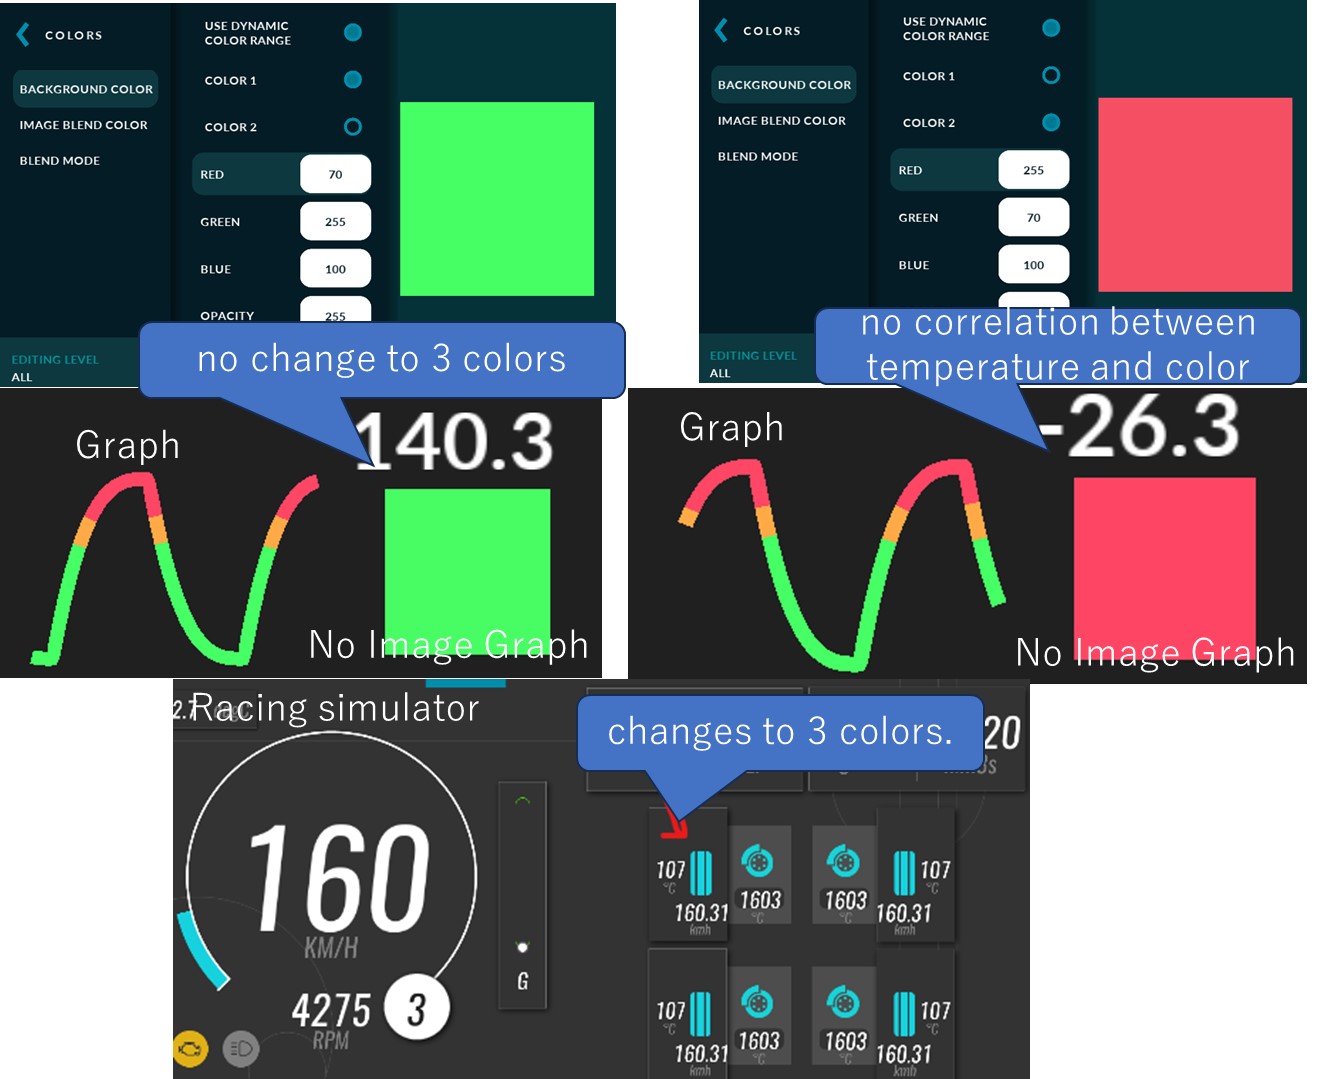
I think I can do it, but it doesn’t change to 3 different colors like the tire temperature in the racing simulator template you created, and there is no correlation between temperature and color.
What am I missing? I’m afraid this is an elementary question.
I have selected green for color 1 and red for color 2 in the dynamic color range.
I have selected green for color 1 and red for color 2 in the dynamic color range.
You have to adjust the dynamic color range for all three levels, normal, warning and critical.
To make smooth color change, idea is that normal range color 2 is set to warning color 1 and warning color 2 to critical color 1
Thanks for the answer.
It took me some time to understand dynamic color, but I generally mastered it.
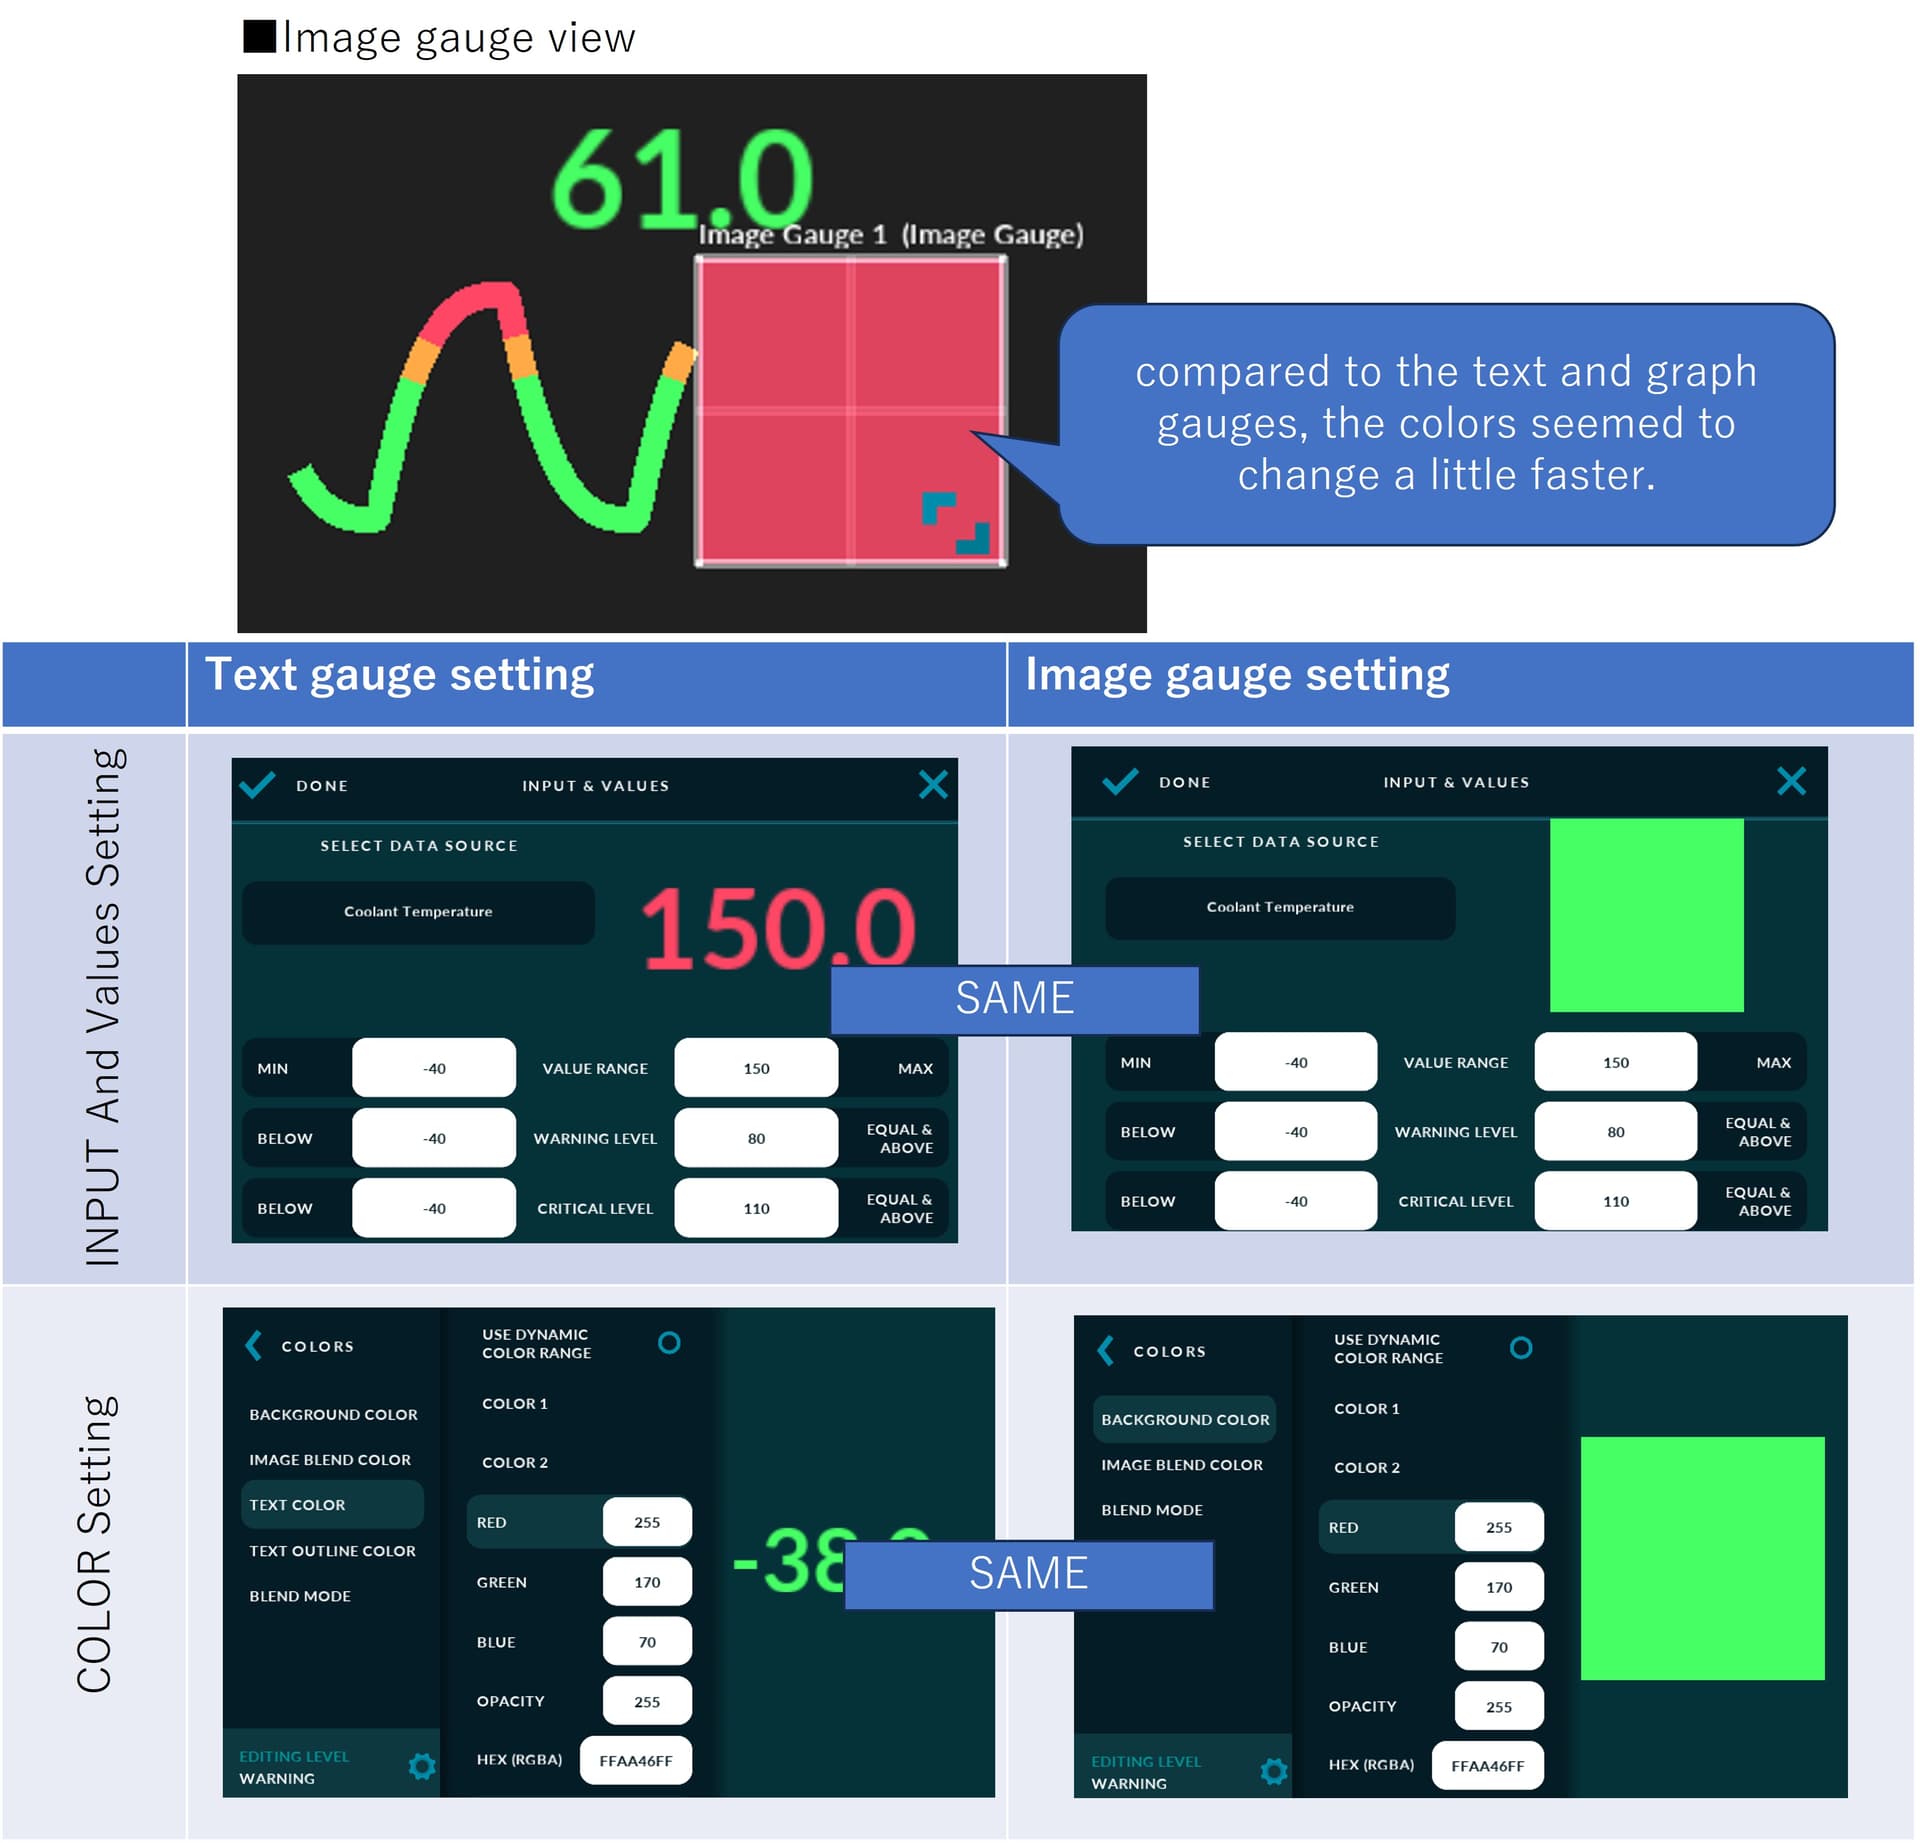
I have set up only three image gauges, normal, warning, and critical, without using dynamic colors.
The colors of the image gauges seemed to respond to the values and switch smoothly.
Compared to the text and graph gauges, the colors seemed to change a little faster.
I have the warnings, critical level, color, value smoothing and history mode set to the same settings, but I don’t know why this is happening.
Could you please advise?
Have you tried checking font and text refresh delay (MS)?
Thanks for the advice.
The refresh delay is set to 0ms, but still, the image gauge is ahead of the motion or is there a delay…
For the text have you tried removing the decimals?
Thanks for the advice.
I also tried setting the decimal point to zero, but that didn’t solve the problem.
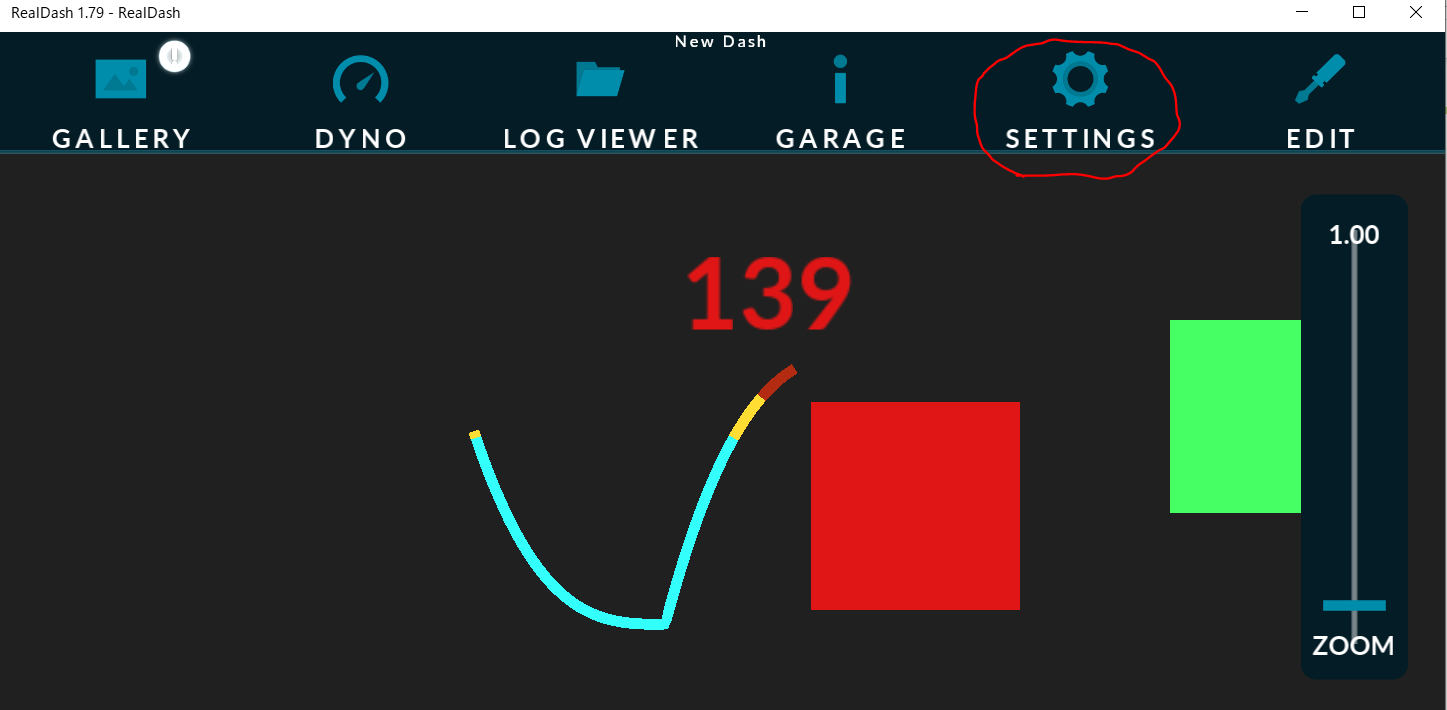
However, I noticed that when I go into the SETTING screen and come back out, the graphs are synchronized.
The problem I was having is solved.
Sorry for the trouble,
I appreciate your help.
1 Like
If you are running the dash in simulation mode, each gauge has its own simulation value and thus they are not synced together.